Documentation Index
Fetch the complete documentation index at: https://docs.mcpmate.io/llms.txt
Use this file to discover all available pages before exploring further.
Quick Actions
From the Dashboard, you can:- Toggle profile on/off
- Restart problematic servers
- View detailed server information
- Access system settings
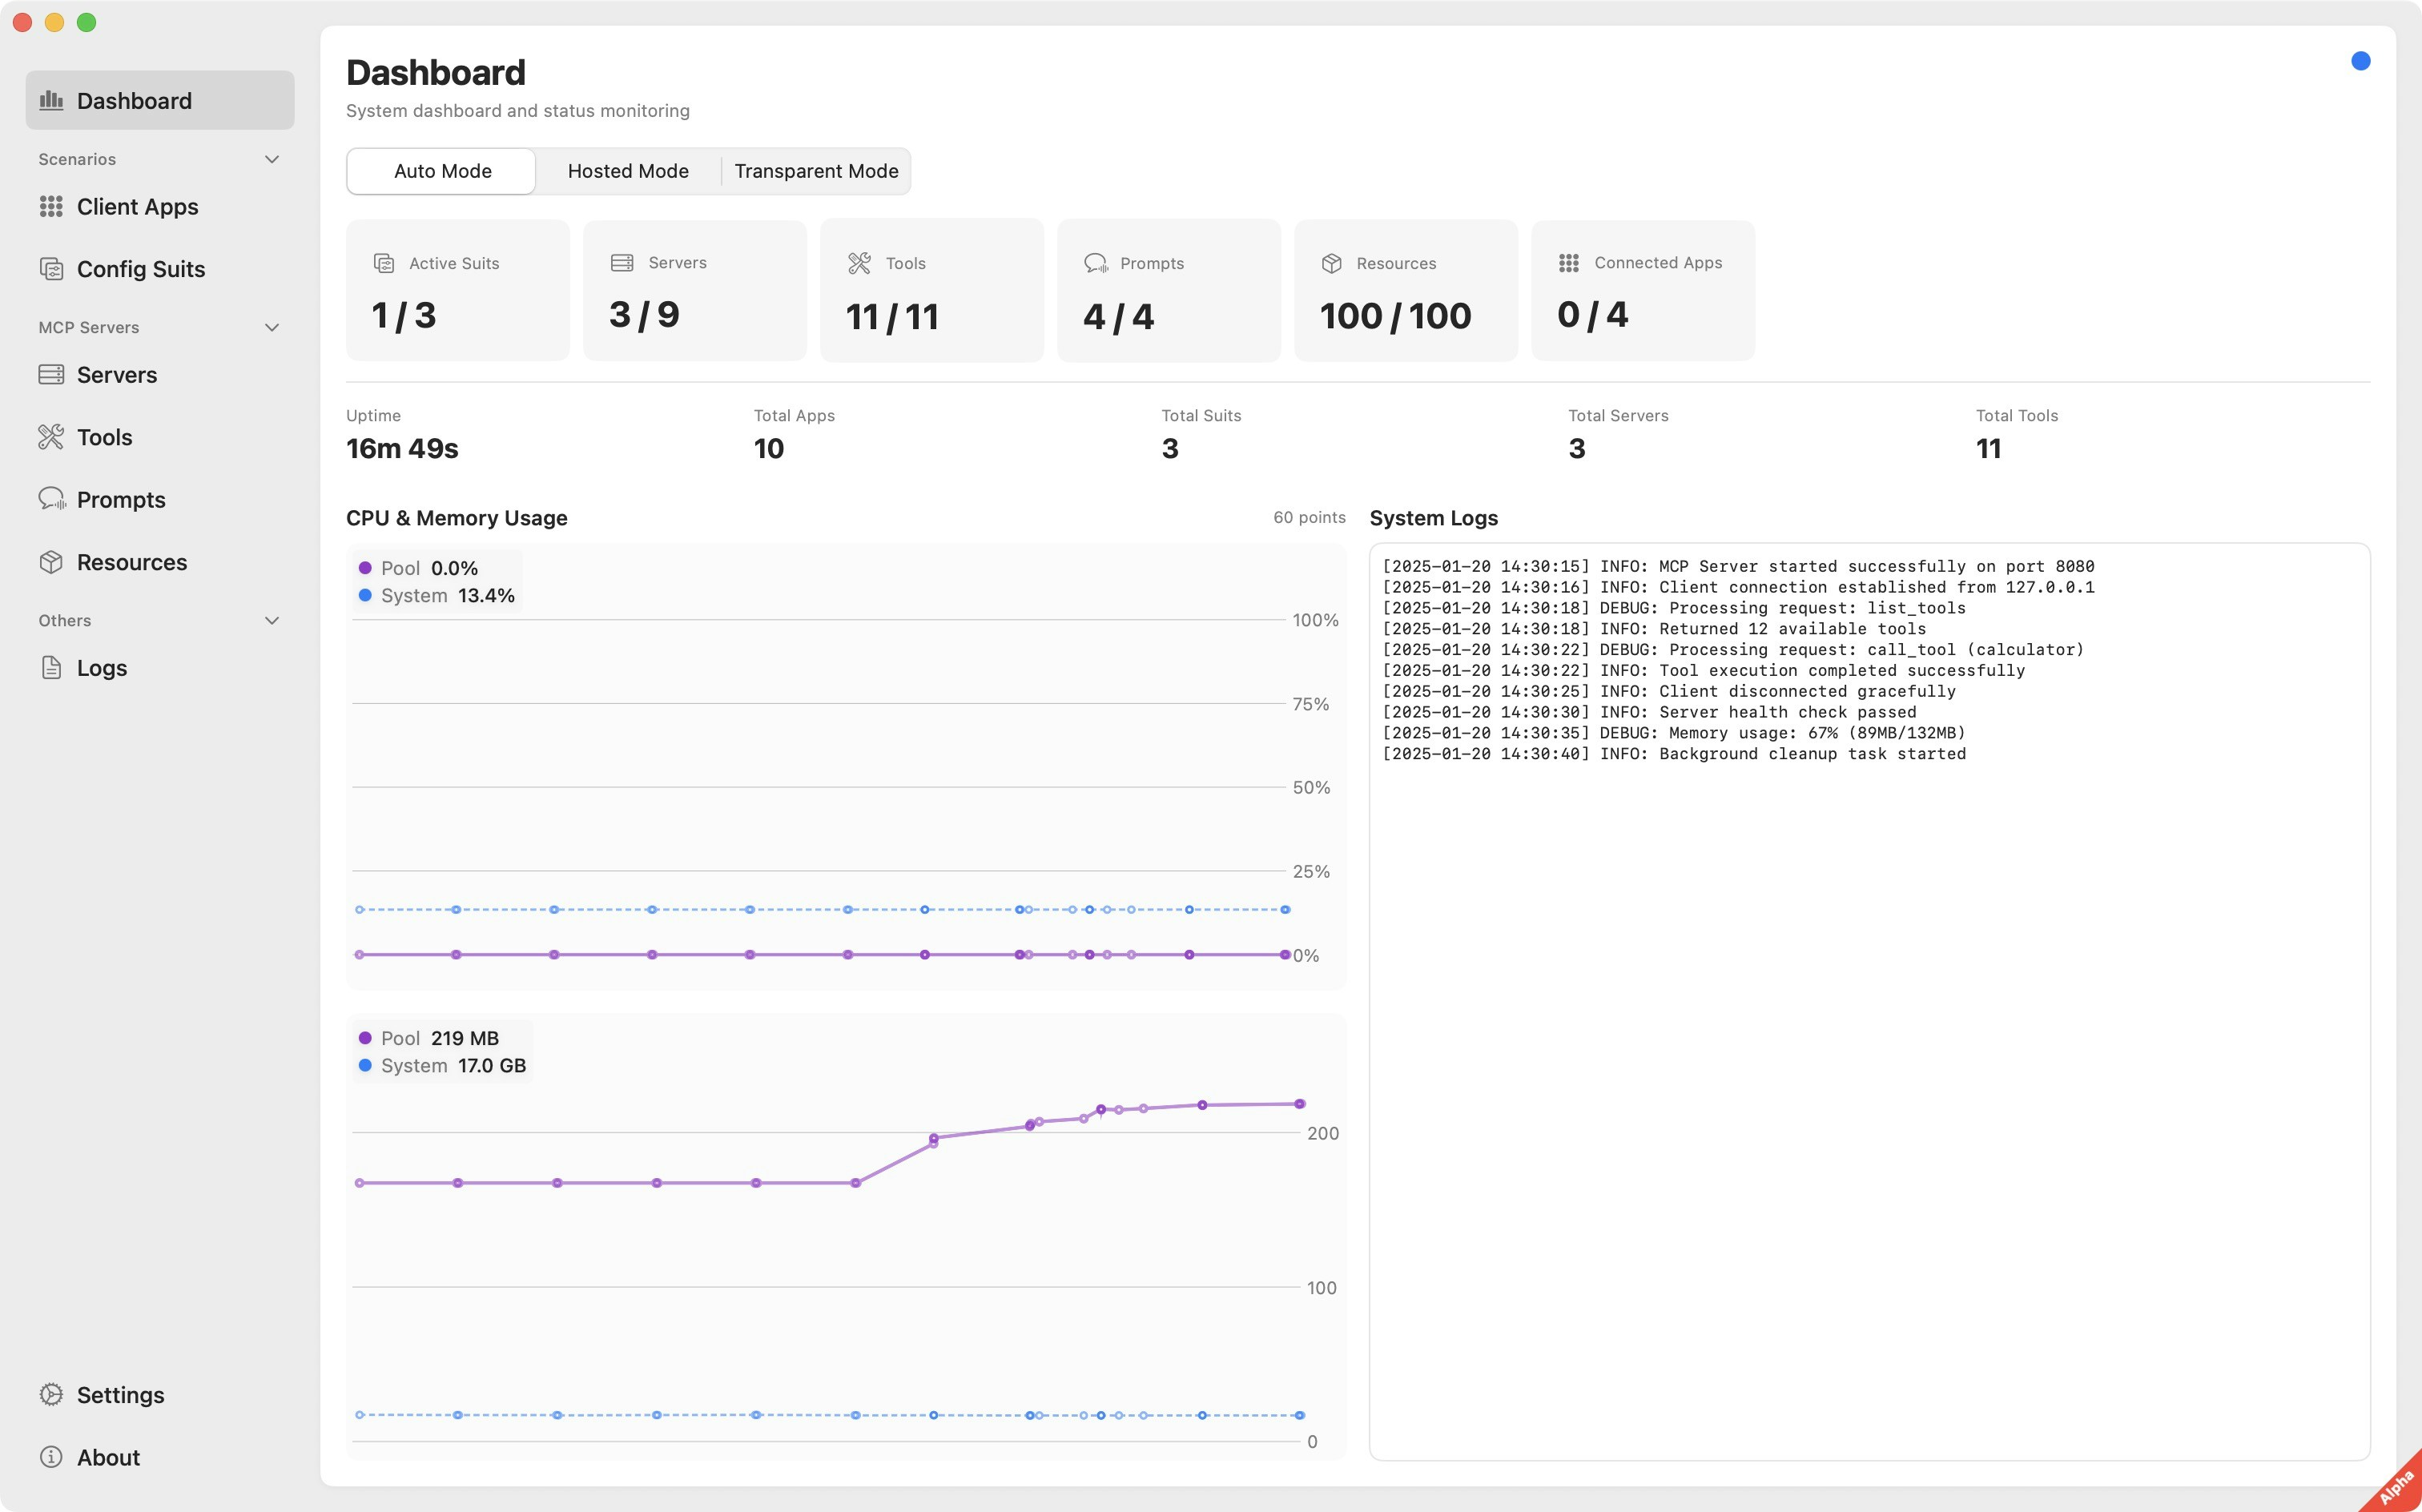
System Status
Active Profile
Shows currently enabled profile and their server count.
Running Servers
Live count of MCP servers with health indicators (green/yellow/red).
Connected Apps
Number of client applications currently using MCPMate proxy.
Resource Usage
Monitor CPU and memory consumption to ensure optimal performance.- CPU Usage: Real-time processor utilization by MCPMate and connected servers
- Memory Usage: RAM consumption with breakdown by component
- Network: Data transfer rates for MCP communications
System Logs
The logs panel shows:- Server startup/shutdown events
- Tool execution requests and responses
- Client app connection status
- Configuration changes
- Error messages and warnings
Log Filtering
Use the filter controls to:- Show logs from specific servers or profile
- Filter by log level (Info, Warning, Error)
- Search for specific messages or timestamps
- Export logs for troubleshooting